GSM Example
The next example is the Global System for Mobile Communication (GSM) system [2]. The specification is depicted in Figure 2 which is a loop-unlimited SBS.
Scenario-based specification for the GSM example
The GSM system consists of eight components. They are phone users (process User), the mobile phone (process Mobile), two Base Station Systems (process BSS and BSS2), two Mobile Switching Centers (process MSC and MSC2), the Public Switched Telephone Network (process PSTN) and the GSM Common Equipment (process GSM). We assume that each MSC has just one BSS, that is MSC is responsible for BSS, and MSC2 is responsible for BSS2.
The user first turns on the mobile, and the mobile checks the signal strength. Then the system goes in three ways. When it is idle, the BSS will check the signal strength in every two seconds (ωt-t1=2, SD Check_Signal), and when the strength is poor, the mobile requests to update the location information. The second flow is the user makes a call the third one is the user receives a page. In both cases a radio resource connection should be established, and the channel would be ciphered. The mobile switches from signaling to voice, after the MSC allocates a voice circuit between BSS and MSC. While on conversation, the mobile reports the signal strength continuously to the MSC via BSS for every ten seconds. And when the signal strength is poor , the call connection would be passed from one MSC to another.
If the connection has not been established or the call has not been setup, the mobile returns to its idle state in [2, 3] seconds (2≤ωe-e1≤3, SD Request_Fail; 2≤ωj-j1≤3, SD Refuse_Answer; 2≤ωr-r1≤3, SD Cut_Off). The mobile also returns to idle state in [2, 3] seconds after the connection is released (2≤ωo-oa≤3, SD Connection_Release). The user can turn off the mobile while it is idle.
We add many constraints to the system. The user expects the mobile to display necessary indications within one second after it receives a message from the network (0≤h6-h4≤1, SD Call_Setup; 0≤ig-ie≤1, SD Mode_Modify; 0≤q6-q3≤1, SD Page_Setup). The user also expects the mobile to executes an command within one second after the user pushes down the buttons (0≤n3-n1≤1, SD Call_Release; 0≤s3-s1≤1, SD Answer).
The specification also describes the following constraints:
-
The process of allocating a channel between the mobile and BSS is accomplished within 2 seconds (0≤f2-d1≤2). If not, the mobile should be informed immediately (e2-d1=2).
-
The process of ciphering the channel takes [0, 2] seconds (0≤g8-g1≤2).
-
The time interval between MSC routing the call to the called subscriber and PSTN indicating MSC that the called subscriber is ringing should not exceed 5 seconds (0≤ie-i9≤5).
-
It takes [B1, B2] seconds for the user to hear the alerting tone after dialing the number and pushing down the Send_button (B1≤ig-c3≤B2).
-
The call should be answered within 25 seconds after the user has made the call (0≤k1-ib≤25). If not, the PSTN informs the MSC that no one could answer the call (j1-ib=25).
-
It takes [0, 5] seconds for a handover request to be accepted (0≤mb-m1≤5).
-
It takes at most W seconds for completing the handover process after GSM ordering MSC to execute the handover command (0≤mu-m7≤W).
-
When the mobile indicates MSC that the call is ended, the connection between the mobile and MSC should be released within 10 seconds (0≤oa-n3≤10).
-
The GSM system takes [0, 10] seconds to update the location information of the mobile (0≤wg-v1≤10).
-
The user must answer the page within 20 seconds after hearing a ring (0≤s1-q6≤20).
We assume each User-Mobile communication takes at least 1 second, each GSM-BSS communication takes at least T1 seconds, each GSM-MSC communication takes at least T2 seconds. And all the other communication time between two processes that we have not mentioned explicitly above is at least 0.5 second.
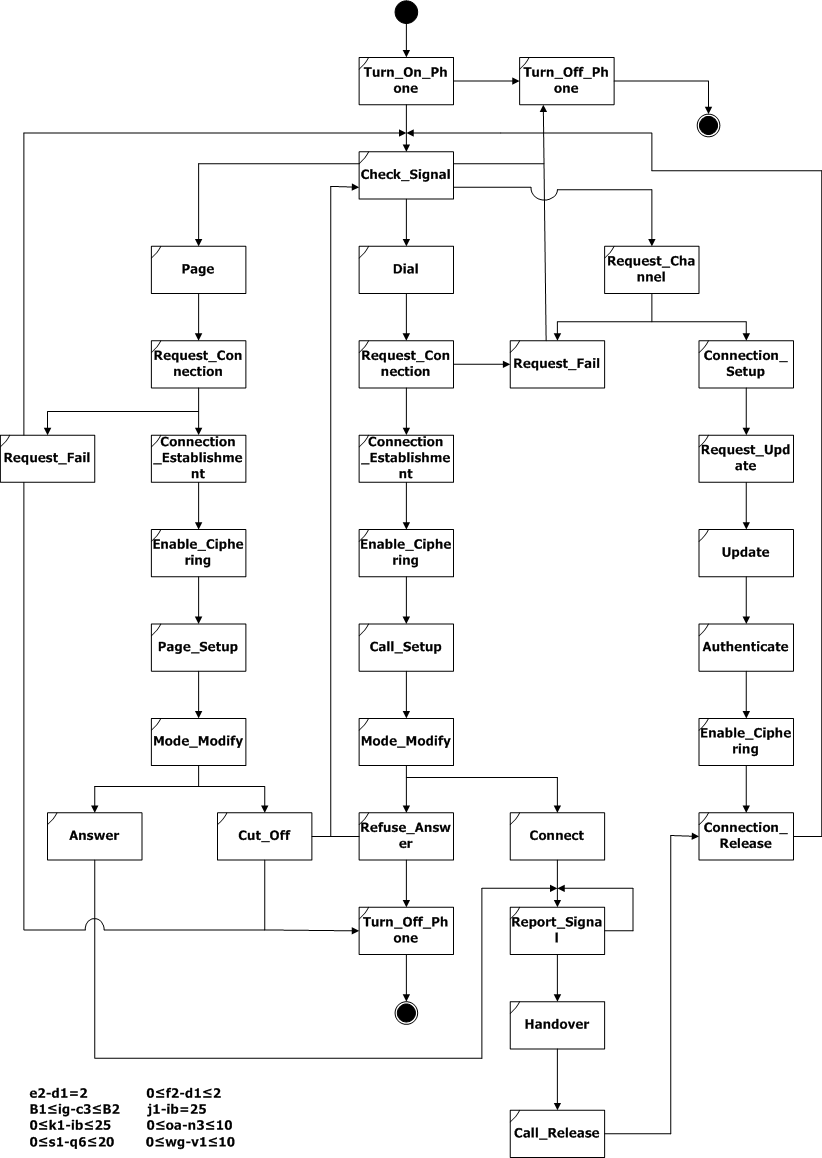


Figure 2: Scenario-based specification for the GSM example
For timing analysis of the GSM specification depicted in Figure 2, TASS is used to solve the following problems:
-
Reachability analysis: we check if the node SD Handover is reachable in the specification.
-
Constraint conformance analysis: for availability consideration, we require the time for establishing a channel is no more than ten times of the time for requesting an establishmeng (f5-d2 <= 10(wd-d1)), which forms a constraint conformance specification Sc(ρ, ζ) where ρ=Request_Connection^Connection_Establishment and ζ=f5-d2 <= 10(wd-d1).
-
Bounded delay analysis: updating the location information of one mobile phone is very complex, e.g.many processes such as Mobile, BSS, MSC, GSM all require updating the information, and the GSM would modify the database. So we require the updating process long enough in order to guarantee correctness, which forms a minimal bounded delay specification SBm(oa,v1,12).
Experiment Data
We created four cases with various values for W, B1, B2, T1, and T2. All the experiments were conducted on a Pentium 4/2.2GHz/2.0GB PC. We selected some sample results from the experiment. Below are the results from timing analysis with synchronous composition semantics.
Table 6 is the results of loop-unlimited timing analysis of GSM SBS. The results show that TASS runs comfortably for checking SBSs with 32 SDs in split seconds.
|
Reachability |
Sc(ρ,ζ) |
SBm(oa, v1, 12) |
|||
Result |
Time |
Result |
Time |
Result |
Time |
|
(1) W=5, B1 = 0, B2 = ∞, T1 = 0.5, T2 = 0.5 |
no |
1.232s |
* |
* |
* |
* |
(2) W=5, B1=10, B2=12, T1=0.5, T2=0.5 |
yes |
63ms |
yes |
795ms |
no |
16ms |
(3) W=5, B1=5, B2=15, T1=0.5, T2=0.5 |
yes |
62ms |
yes |
796ms |
no |
16ms |
(4) W=6, B1=5, B2=15, T1=1, T2=1 |
yes |
62ms |
yes |
780ms |
yes |
125ms |
*:the verification problem disappears because the node is unreachable.
Table 6: Sample results of loop-unlimited timing analysis of the GSM specification
We also evaluated the bounded timing analysis of GSM SBS with case 4. We set k to 30 so that the number of paths checked was beyond four hundred thousand. Moreover we observed that during the computation TASS consumed less than 50MB of memory. This advantage comes from our DFS manner in traversing the specifications. Since TASS can do the analysis without manual interference, given enough time it is possible to check a large amount of paths.
|
Reachability |
Sc(ρ,ζ) |
SBm(oa, v1, 12) |
|||
path |
time |
path |
time |
path |
time |
|
15 |
1 |
78ms |
28 |
374ms |
27 |
250ms |
20 |
1 |
125ms |
922 |
23.276s |
816 |
13.244s |
25 |
1 |
156ms |
22574 |
947.778s |
19374 |
546.515s |
30 |
1 |
192ms |
495570 |
32741.155s |
419365 |
19463.581s |
Table 7. Sample results of bounded timing analysis of the GSM specification
[2] "Telecom Message Sequence Charts", EventHelix.com Inc. http://www.eventhelix.com/EventStudio/telecom_message_sequence_charts/